LONG SHORT EQUITY: Long Wynn Resorts, Short Las Vegas Sands
A long-short equity idea from a proven investment process
Summary
Relative bullishness on Wynn Resorts (WYNN) due to structural market and profit share gains, margin improvements and strategically wise decisions on marketing spend.
Relative bearishness on Las Vegas Sands (LVS) due to exposure to riskier geographies, lagging position in digital and online gaming investments and expectations of increased competitive intensity.
Sentiment analysis on WYNN/LVS shows sharp rebound from fresh lows, currently in consolidation phase preceding anticipated breakout.
Long the WYNN/LVS spread at 2.33 with stop loss at 1.80 and take profit at 2.89 for a market-neutral bet on relative outperformance of WYNN over LVS
Note: Sources for data and insights are from the companies’ source filings such as 10-Ks, 10-Qs, concalls, stock price data, LinkedIn, etc…
Business Brief - Wynn Resorts
Wynn Resorts (WYNN) is an Nevada-headquartered casino gaming business founded in 2002. It designs, develops and operates integrated casinos and resorts in the US and Macau. It focuses on the premium segment.
Business Segments
The company was making over $1.6bn per quarter or over $6.4bn per year before COVID-19. Last 2 quarters, this has fallen to 60% of pre-COVID levels.
Most of the revenues come from the Casinos business, which currently makes up 50% of total revenues. This is expected to increase to previous levels of 70% as COVID-19 subsides and normalcy continues.
Pre-COVID, Las Vegas contributed to ~22% of total revenues and Macau 68%. However, this has changed to 48% for Las Vegas and 32% for Macau as the recovery in the latter has been slower.
Note: Q2 FY20’s figures go beyond chart scale
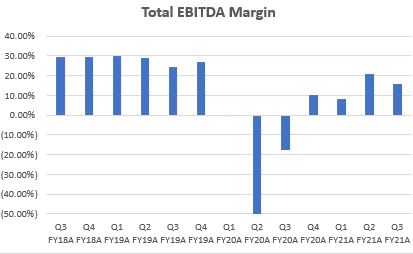
EBITDA margins used to be above 25% pre-COVID. Now, they are between 15% to 20%.
Note: Q2 and Q3 of FY20’s figures go beyond chart scale
The drop in overall EBITDA margins is mostly due to slower recovery in Macau. From ~30% EBITDA margins pre-COVID, the company is now operating at <15% EBITDA margins.
Note: Q2 FY20’s figures go beyond chart scale
However, Wynn Resorts’ US business in Las Vegas and Boston has bounced back strongly record high margins above 30%. Las Vegas in particular is operating at more than 20% higher EBITDA margins than pre-COVID levels.
Business Drivers - Wynn Resorts
3 key drivers for Wynn Resorts are:
Profit share gains
Operating costs management
CEO Change
Profit Share Gains
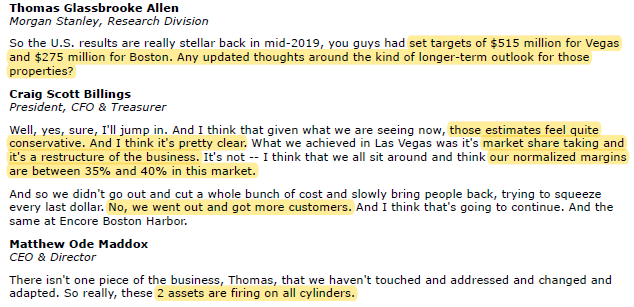
In the Q3 FY21 concall, management mentioned they are passing on price increases without losing demand. They are revising their pre-COVID expectations on run-rate margins higher for the Las Vegas and Encore Boston business to 35% to 40%, implying a structural 20% increase in US business margins. They are noticing broad-based market share gains in all their product/service lines; hotels, food and beverage and casinos:
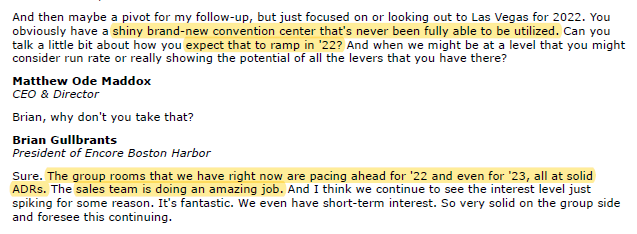
The company’s plan for scalability in the US is to shift focus towards the broader mass premium segment and entry into new, affluent regions such as New York:
Clearly, all this commentary suggests that Wynn Resorts will come out of COVID-19 in a much stronger competitive position, with US-driven growth.
Operating Costs Management
Wynn Resorts seems to be disciplined on costs management, with a long-term life-time-value focussed approach to customer acquisition.
Management noted that for Wynn Interactive, their sports-betting business, they are seeing very high competition in the market. The market structure is fragmented with aggressive competitors spending heavily on marketing via significant bonus offers to gain customer share.
I believe Wynn has made a strategically wise decision to not imitate aggressive competitors in this area. In an oligopolistic market structure, matching competitors’ aggressive marketing spends may make sense. However in a fragmented market, the marginal utility of playing that game is not as high as the chances of winning that battle against multiple opponents is lesser. It is more prudent to let the dog-fight happen and then aggressively focus efforts on winning share from the market leader.
Another positive sign of sustainability is that the company has been able to hire and retain its people despite mass labor shortages in the industry. This is due to Wynn treating their employees better than competitors. For example, they paid their employees even during business shutdown and became a leading example for sustainable employee management in the vicious hospitality industry:
Wynn Resorts’ cost management is focussed on prudent, efficient spending rather than a rash rush to gain indefensible share. This balanced focus towards growth and profitability is likely to make the stock less prone to exuberance, bubble euphoria and the inevitable crash.
CEO Change
Wynn Resorts is having a CEO change. After 20 years at the company, Matthew Maddox is stepping down to pursue other things. He will be succeeded by Craig Billings, who has been at Wynn for almost 5 years now as the CFO.
Craig Billings has 20+ years experience in Finance, especially in the Gaming industry. He has held multiple CXO and Directorship roles at relevant casino gaming companies such as Zen Entertainment, Aristocrat Limited and NYX Gaming group prior to joining Wynn Resorts. He was also Vice President in Investment Banking at Goldman Sachs, leading Real Estate, Leisure and Gaming coverage. He has also been an independent Advisor and Investor in the industry.
As Wynn Resort transitions to its next phase in its sustainable growth path, good capital allocation skills and alignment with shareholders will be key. Craig Billings’ finance and investing experience is therefore a good fit for this role.
Here is what former CEO Matthew Maddox had to say about Craig Billings’ appointment:
Valuation - Wynn Resorts
Wynn Resorts’ 1-yr forward EV/EBITDA multiple stands at 16.9x as at 1st December 2021. Due to major structural improvements in US operations discussed in the previous section, an upwards re-rating is expected as the Macau operations recover.
Management remains optimistic on the Macau, stating that the local government there has been very transparent and co-operative with them:
However, the stock does not appear to be very undervalued from a valuations perspective as it is trading significantly higher than its long-term trading range of 13.3x EV/EBITDA.
Sentiment Analysis - Wynn Resorts
Business Brief - Las Vegas Sands
Las Vegas Sands (LVS) is an Nevada-headquartered casino gaming business founded in 1988. It develops, owns and operates integrated casinos and resorts in Macau, Marina Bay, Singapore and Las Vegas in the US. It focuses on the mass market segment.
Business Segments
The company was making over $3bn per quarter before COVID-19. Post-COVID, the company is clocking in around $1bn per quarter in revenues on average, which is just 33% of previous levels.
Most of the revenues come from the Casinos business, which currently makes up 62% of total revenues. This is expected to increase to previous levels of 70% as COVID-19 subsides and normalcy continues.
Unlike Wynn Resorts, Las Vegas Sands is exposed only to foreign operations in Macau and Marina Bay (Singapore). The company sold its Las Vegas properties for $6.25bn at a valuation of 12.8x EV/EBITDA. This was because Las Vegas Sands was losing to loss of share from competitors and online gambling substitute options. Now, Las Vegas Sands only has operations in Macau and Singapore. Perhaps a company name change is also in order…
Note: Q2 FY20’s figures go beyond chart scale
Pre-COVID, the company was operating at 35% EBITDA margins. Margins have not yet stabilized now with recent quarters barely breaking 10% and the last quarter making EBITDA losses as well due to higher property and corporate expenses.
Note: Q2 FY20 and Q3 FY20’s figures go beyond chart scale
Macau tracked 35% EBITDA margins pre-COVID. Currently it is still hovering around 10% EBITDA margins. The situation has not normalized due to a slower recovery of travel activity.
Note: Q2 FY20’s figures go beyond chart scale
Marina Sands tracked 50% EBITDA margins pre-COVID. As the recovery is not yet at pre-COVID levels, this geography has been hitting 30% EBITDA margins, except for the last quarter, which had 6% EBITDA margins due to Singapore operations being closed for a portion of Q3 FY21.
Business Drivers - Las Vegas Sands
3 key drivers for Las Vegas Sands’ business are:
Exposure to Riskier Geographies
Lagging Investments in Digital initiatives
Relative lack of experience in post-COVID recovery
Exposure to Riskier Geographies
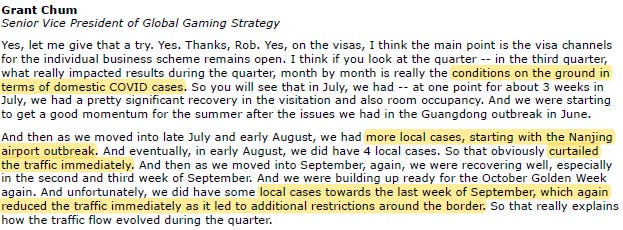
As seen by the business mix, Las Vegas Sands has exposure only to Macau and Singapore. This means from a business continuity perspective, the company has more concentrated exposure to regulatory risk. This is particularly acute as Singapore and Macau tend to be on the more cautious and conservative side in lifting travel restrictions. As business from both Macau and Marina Sands is largely tourist-driven, this impacts Las Vegas Sands’ business negatively.
Here is some commentary about what led to a weaker top-line in Q3 FY21:
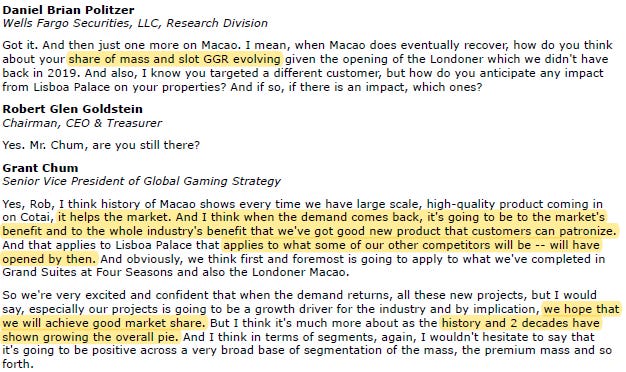
Furthermore, unlike in Wynn Resorts’ case, management commentary for Las Vegas Sands did not suggest any confident claims of increase in market share. Rather, management focussed on the macro driver of the demand in the industry for everyone once normalcy to pre-pandemic levels is achieved:
Thus, compared to Wynn Resorts, which is benefiting from very strong demand and market share gains, Las Vegas Sands’ outlook is a lot more bleak with low visibility. Indeed, even management of Las Vegas Sands has no confidence about when activity will pick up:
Lagging Investments in Digital Initiatives
The former CEO of Las Vegas Sands, Sheldon Anderson opposed online gambling and tried to fight this demand substitute threat by lobbying with politicians, among other things. This has left the company behind in digital and online gambling.
More worryingly, even under the current CEO, Robert Goldstein, the company is adopting a very slow and gradual approach to investing in digital initiatives. This handicaps the company’s ability to make the necessary investments to catch up to the competition:
Notice the uncertain language by the COO; “and sort of build from there”…
In contrast, Wynn Resorts has a clear strategic plan to grow its share of the online gambling business with Wynn Interactive. Hence, Las Vegas Sands fares worse relative to Wynn on this parameter as well.
Relative Lack of Experience in Post-COVID Recovery
Management of Las Vegas Sands frequently referred to the strong demand activity in Las Vegas (the geography they exited) to justify strong demand recovery in their geographies of Macau and Marina Bay. They are very confident of seeing a strong boost in their core geographies once demand picks up, although it is uncertain when that will occur:
However, the disadvantage Las Vegas Sands has is that it would be facing the strong pent-up demand recovery environment for the first time. But its competitors such as Wynn Resorts who have witnessed and operated during the Las Vegas recovery would be coming into Macau with an edge in operational learnings. This is likely to lead to more tough and intense competition for Las Vegas Sands.
Valuation - Las Vegas Sands
Las Vegas Sands’ 1-yr forward EV/EBITDA multiple stands at 20.6x as at 1st December 2021. Due to the business challenges from riskier geographies, lagging position in online and digital gaming initiatives and expectations of increased competitive intensity when demand picks up, a downwards re-rating is expected.
Given the relatively worse positioning from COVID-19, Las Vegas Sands seems to be a relative loser in the industry over the last 2 years. Hence, it would not be surprising if the stock trades below its long term multiple 11.7x 1-yr forward EV/EBITDA in the new normal.
Sentiment Analysis - Las Vegas Sands
Fundamental Analysis View - WYNN/LVS
Based on the individual analysis of Wynn Resorts (WYNN) and Las Vegas Sands (LVS), WYNN is expected to outperform LVS.
Sentiment Analysis View - WYNN/LVS
Source: Trading View and Own Sentiment Analysis Edge developed over years
Beta-Hedged Position Sizing
In long-short equity, it is important to hedge out beta exposure to correct for the fact that one stock may move relatively more than another.
1 Year Beta of WYNN = 1.49
1 Year Beta of LVS = 1.49
Hence position sizing ratio for long WYNN, short LVS = 1.49/1.49 = 1.00 to bet on relative outperformance of WYNN over LVS without exposure to market risk.
Playing the Opportunity
Long Wynn Resorts (WYNN), Short Las Vegas Sands (LVS) is a beta-hedged long/short equity idea where the relative outperformance of the long is expected to be the dominant driver of value creation.
Net exposure on long WYNN, whilst possible, may not be the best play in light of other, more attractive market opportunities since the industry is still subject to business continuity risk.
Best,
Raj Arishtocrat


