LONG SHORT EQUITY: Long Cincinnati Financial, Short Hershey Co
A long-short equity idea from a proven investment process
Summary
Relative bullishness on Cincinnati Financial Corporation (CINF) due to robust industry outperformance and positive industry tailwinds.
Relative bearishness on Hershey Co. (HSY) due to challenges of M&A focussed strategy used to diversify core portfolio and revive growth.
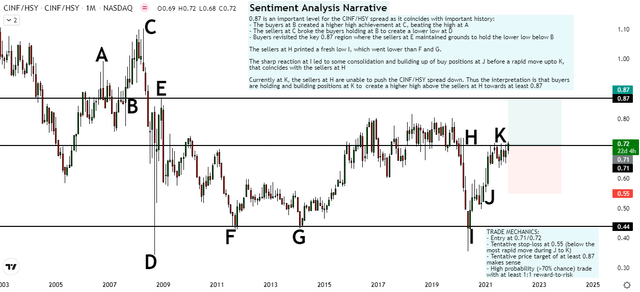
Sentiment analysis on CINF/HSY shows sharp rebound from fresh lows, currently in consolidation phase preceding anticipated breakout.
Long the CINF/HSY spread at 0.71 with stop loss at 0.55 and take profit at 0.87 for a market-neutral bet on relative outperformance of CINF.
Alternatively, long CINF for a bet with exposure to market risk and return prospects.
Business Brief - Cincinnati Financial
Cincinnati Financial Corporation (CINF) is an Ohio-headquartered insurance company founded in 1950. It makes money in property, casualty and life insurance offerings sold to commercial and individual clients.
Business Segments
Source: Company's 10-Ks and 10-Qs
The commercial lines segment, which includes casualty, property, commercial auto, and workers’ compensation, etc coverage makes up around 52% of the total revenues. Between 35% to 40% of the commercial line insurance segment premiums come from the construction segment. This results in Cincinnati Financial having relatively higher concentration towards contractor-related business than the industry average (Source: FY20 10-K).
The personal lines segment, which mainly includes auto and homeowner coverage makes up around 21% of total revenues.
The life insurance products suite makes up 4.1% of the revenues mix.
The excess and surplus lines segment includes insurance coverage for more specialized business applications. This makes up 3.9% of overall revenues.
Investment income contributes 16% of the top-line.
Industry Structure & Business Model
Property casualty insurers typically sell insurance through independent agents that represent multiple insurance companies, captive agents that exclusively sell a particular insurance company's products or via direct marketing to customers.
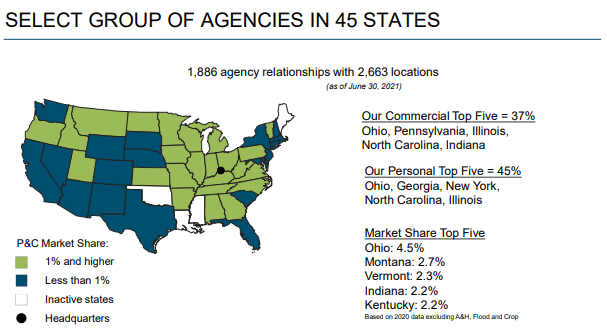
Cincinnati Financial's distribution model is based on regional independent insurance agents spread across the United States:
Success is dependent on accumulation of regional market shares because the industry is very fragmented. The top 25 insurers command a market share of only 67%. The market leader, State Farm Group has 9.12% share, whilst the 2nd largest player, Warren Buffett and Charlie Munger's Berkshire Hathaway (BRK.B) subsidiary GEICO has 6.37% share. Cincinnati Financial stands 25th in market share with just a 0.77% share.
The fragmented nature of the industry implies there is scope for strong operators to gradually gain market share.
Business Drivers - Cincinnati Financial
3 key drivers for Cincinnati Financial's business are:
Growth in Insurance Premiums
Strong Operating Excellence
Sustainable Investment Income and Capital Growth
Growth in Insurance Premiums
Cincinnati Financial's independent agency distribution model is geared towards empowering local decision making, enabling better service quality and hence increase in regional market share. The company has a track record in growing regional agency share over time, having been able to capture around 11.6% share of business with an independent insurance agency after a 10 year relationship:
Source: August 2021 CINF Investor Handout
This increase in market share is also supported by superior premiums growth relative to peers:
Source: May 2021 CINF AGM
The company is gradually increasing its presence across geographies and is on a strong growth path. New agents appointed in the 2016 - 2020 period accounted for 84% of its current standard insurance lines business.
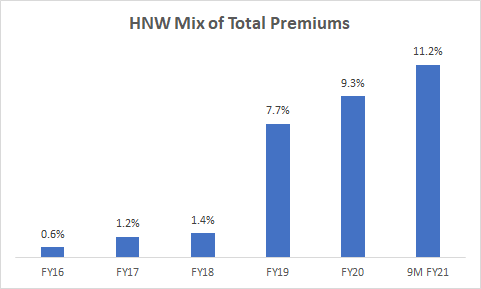
The business is also expanding its product suite and clientele mix, targeting more high net worth (HNW) clientele:
Source: Company's 10-Ks and 10-Qs
The focus on HNW clients is a good strategic move given the widening wealth inequality gap:
Source: Board of Governors of the Federal Reserve System, Washington Post
COVID-19 has benefited many companies with business models catered towards the spending dollars of wealthier clientele. For example, amid mass retail store struggles, luxury furniture retail company RH (RH) has gone up 207% since the start of 2020:
This is certainly an outlier as furniture retailers have had it tough during COVID-19. At least 3 furniture companies in the United States have gone bankrupt since March 2020; Art Van Furniture, Furniture Factory Outlet and Loves Furniture.
All this gives reason to be optimistic on Cincinnati Financial's structural premiums growth prospects.
Strong Operating Excellence
A key measure of operating excellence for an insurance company is the Combined Ratio. The Combined Ratio is defined as follows:
Source: Investopedia
Simply put, this metric measures the payments an insurance company makes during the course of its business operations for every dollar of insurance premiums earned. A Combined Ratio of less than 1 implies profitable operations for the insurance business. In the industry, a Combined Ratio lower than 95% is considered excellent.
Cincinnati Financial has reported consistently profitable operations above industry average:
Source: May 2021 CINF AGM
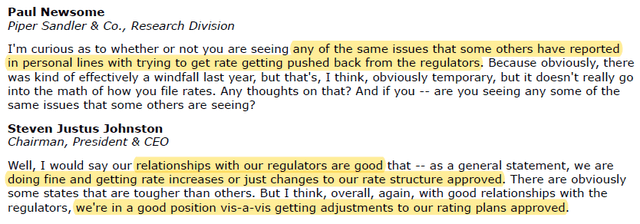
For the 9 months of FY21 so far, the company has operated at a Combined Ratio of 90.9%. A key driver of this is increased renewal rates for premiums. The company is showing signs of being able to increase pricing whilst some of its peers are struggling to do so:
Source: 3QFY21 Concall Transcript
Note that pricing increases are generally structural changes as they are rarely undone. Management also expects continued pricing precision and broad rate increases to lower the Combined Ratio even further over the long term.
All this gives a good outlook on Cincinnati Financial's operating efficiency and profitability.
Sustainable Investment Income and Capital Growth
Cincinnati Financial's $22.8bn investment portfolio mix as at September 30 2021:
Source: Q3FY21's 10-Q
Cincinnati's bond portfolio exceeds insurance reserves liabilities by more than 25%. On the equity side, the company's investment strategy is to focus on long term growth and income appreciation, which is why the portfolio is aligned towards diversified dividend-paying blue-chips with a slight value focus.
Source: Own analysis of 10-K, 10-Q filings
Since 1998, Cincinnati has achieved 5.41% CAGR returns on its investment portfolio. Inflation during this time period averaged 2.3% annually, implying some value addition from the investment portfolio segment as well.
Source: May 2021 CINF AGM
Valuation - Cincinnati Financial
Cincinnati Financial's P/B multiple currently stands at 1.72x as of 5th November 2021. Due to aforementioned expectations of continued market share improvement and structural levers in elevating operating performance, it is reasonable to expect the stock to trade at higher multiples in future. This leads to a relative undervaluation assessment of the stock CINF:
Source: Own analysis of company filings, stock price data
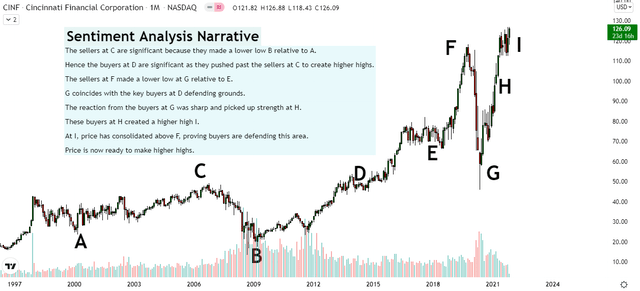
Sentiment Analysis - Cincinnati Financial
Source: Trading View and Own Sentiment Analysis Edge developed over years
Analysis of the sentiment via the price and volumes print supports reasons to be bullish on the CINF stock.
Business Brief - Hershey Co
The Hershey Company (HSY) is a Pennsylvania-headquartered global confectionary leader founded in 1894. It makes money by selling chocolate, sweets, mints, gums, other snacks and pantry items. It has a presence in 85 countries under more than 90 brand names.
Business Segments
Source: Company's 10-Ks and 10-Qs
Hershey's revenue growth has been slow with a 4-year CAGR of only 2.3% since FY16. Since 2018, the company has divested many acquisitions it had made since 2005 due to lower than expected profitability. During this time, the company has also been diversifying its traditionally sweets-concentrated category portfolio into other healthier and more savory lines:
Source: May 2021 AGM Presentation
Industry Structure
In the US market, the confectionery industry includes more than 1200 brands and 1000 companies. The key players in the confectionary market are Hershey, Mars, Ferrero/Ferrara/Nestle, Lindt/Ghir/R.Stover, Mondelez, private labels and other regional players. Only 15 to 20 companies in the US have national distribution scale. Hershey is the market leader with 32% market share, followed by Mondelez with 27.2% share. (Source: Hershey Factbook)
The US confectionery industry growth is slow with only a 1.4% CAGR over the last 4 years:
Source: Hershey Factbook
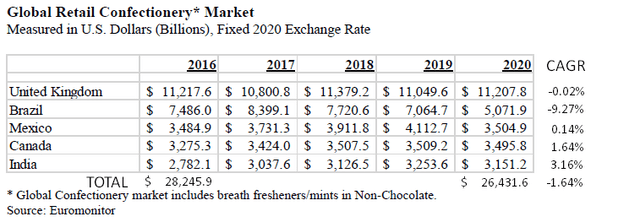
The global confectionery market has also shown weak growth:
Source: Hershey Factbook
Consumers' changing preferences towards healthier foods has been one of the key reasons for the slower growth of Hershey's categories. This trend is expected to continue; market research shows that whilst snacking has increased by 31% since 2020, the type of snacking is moving more towards healthier options, including meal replacements.
Overall, these industry dynamics pose a transitioning challenge to Hershey's flagship portfolio brands that lean more towards the unhealthy side.
Business Drivers - Hershey Co
The most important driver for Hershey now is how well it diversifies into healthy snacking lines. To assess this, 2 key things are considered:
Snacks Portfolio Positioning
Capital Allocation
Snacks Portfolio Positioning
Hershey's brand represents mass-market indulgence confectionery, traditionally on the sweeter side. Within this space, the company has clear leadership. The company's strategy in the healthier category lines is to strike a balance between health and taste by including chocolate or yoghurt in its fruit and nut bars, or including some fruit in protein squeezes.
As large incumbent confectionery brands such as Hershey, Mars and Mondelez look to re-orient towards healthier categories, tough competition comes from smaller players that typically focus exclusively on healthier snacks. For example, many upcoming brands such as GreenPark's Hippeas are competitors to the likes of Hershey, Mars, Mondelez. These newer startup brands often have management coming from the existing confectionery players. And whilst they are prime acquisition targets for the larger players, Hershey's growth trajectory being reliant on acquisitions of strong brands amidst tough competition does inject more uncertainty and risk in the company's future growth path. This concern is now explored more deeply:
Capital Allocation
Hershey's growth is largely dependent on successful M&A of healthy snacking brands. The following shows Hershey's acquisitions of healthy snack brands over the past 5 years:
Source: 10-Q transcripts, Hershey Factbook
*EV/Sales is the technically correct metric. P/S is used due to limited data
Hershey has also divested many businesses in recent years, having taken write-offs and divestments in 6 acquired brands over the last 6 years. In the Shanghai Golden Monkey acquisition, the divestments happened within 4 years of acquiring the brand, after write-offs totalling more than 60% of initial purchase consideration:
Sources: Hershey Factbook and Press Releases
Overall, the company's more recent acquisitions make strategic sense for Hershey to diversify its portfolio and access higher growth levers. Although this seems like a necessary move for Hershey, the company's own history shows that rapid acquisition driven growth is prone operational execution risks. The high competition for good acquisition targets also makes value addition tough for traditional confectionery companies. John Stanton, a professor of food marketing at St. Joseph's University describes the situation well:
Buying food companies is like picking winners at racetracks. You've got 10 entrepreneurs, and they are all going neck-and-neck, and you've to pick the one you're going to place your bet on.
Valuation - Hershey Co
Hershey's EV/EBITDA multiple currently stands at 16.93x as of 5th November 2021, which is close to all-time-highs. Due to the snacks portfolio competition and acquisition-dependent growth risks aforementioned, it is reasonable to expect the stock to at least remain at current multiple levels. This leads to a relative neutral or overvaluation assessment of the HSY stock.
Source: Own analysis of company filings, stock price data
Sentiment Analysis - Hershey Co
Source: Trading View and Own Sentiment Analysis Edge developed over years
Analysis of the sentiment via the price and volumes print supports reasons to be less bullish on HSY, with a default neutral view and bear view in the best case scenario.
Fundamental Analysis View - CINF/HSY
Based on the individual analysis of Cincinnati Financial (CINF) and The Hershey Company (HSY), CINF is expected to outperform HSY.
Sentiment Analysis View - CINF/HSY
Source: Trading View and Own Sentiment Analysis Edge developed over years
Beta-Hedged Position Sizing
In long-short equity, it is important to hedge out beta exposure to correct for the fact that one stock may move relatively more than another.
1 Year Beta of CINF = 0.79
1 Year Beta of HSY = 0.79
Hence position sizing ratio for long CINF, short HSY = 0.79/0.79 = 1.00 to bet on relative outperformance of CINF over HSY without exposure to market risk.
Playing the Opportunity
Long Cincinnati Financial (CINF), Short Hershey Co. (HSY) is a beta-hedged long/short equity idea where the long idea is expected to be the dominant driver of value creation.
Hence, if the investor/trader chooses to take on some market risk instead of betting purely on relative outperformance, it would also be fine to allocate more towards a long CINF position. It is also possible to only buy CINF without an offsetting short since Cincinnati Financial's fundamentals and sentiments are bullish.
However, it would not be prudent to short HSY without any offsetting long since Hershey's fundamentals and sentiments are not bearish enough to justify a short that would generate positive returns on its own.
Update (14 December 2021)
I am exiting the CINF/HSY long/short position at 0.62 on the spread due to weak price action movement.
Best,
Raj Arishtocrat













I am exiting this today at 0.62 in the CINF/HSY spread. Exit update shown in article.